> ## Documentation Index
> Fetch the complete documentation index at: https://wb-21fd5541-docs-sandboxes-integrations-placement.mintlify.site/llms.txt
> Use this file to discover all available pages before exploring further.
> Explore how to use W&B Tables with this 5 minute Quickstart.
# Tutorial: Log tables, visualize and query data
export const ColabLink = ({url}) =>
Try in Colab
;
The following Quickstart demonstrates how to log data tables, visualize data, and query data.
Select the button below to try a PyTorch Quickstart example project on MNIST data.
## 1. Log a table
Log a table with W\&B. You can either construct a new table or pass a Pandas Dataframe.
To construct and log a new Table, you will use:
* [`wandb.init()`](/models/ref/python/functions/init): Create a [run](/models/runs/) to track results.
* [`wandb.Table()`](/models/ref/python/data-types/table): Create a new table object.
* `columns`: Set the column names.
* `data`: Set the contents of each row.
* [`wandb.Run.log()`](/models/ref/python/experiments/run.md/#method-runlog): Log the table to save it to W\&B.
Here's an example:
```python theme={null}
import wandb
with wandb.init(project="table-test") as run:
# Create and log a new table.
my_table = wandb.Table(columns=["a", "b"], data=[["a1", "b1"], ["a2", "b2"]])
run.log({"Table Name": my_table})
```
Pass a Pandas Dataframe to `wandb.Table()` to create a new table.
```python theme={null}
import wandb
import pandas as pd
df = pd.read_csv("my_data.csv")
with wandb.init(project="df-table") as run:
# Create a new table from the DataFrame
# and log it to W&B.
my_table = wandb.Table(dataframe=df)
run.log({"Table Name": my_table})
```
For more information on supported data types, see the [`wandb.Table`](/models/ref/python/data-types/table) in the W\&B API Reference Guide.
## 2. Visualize tables in your project workspace
View the resulting table in your workspace.
1. Navigate to your project in the W\&B App.
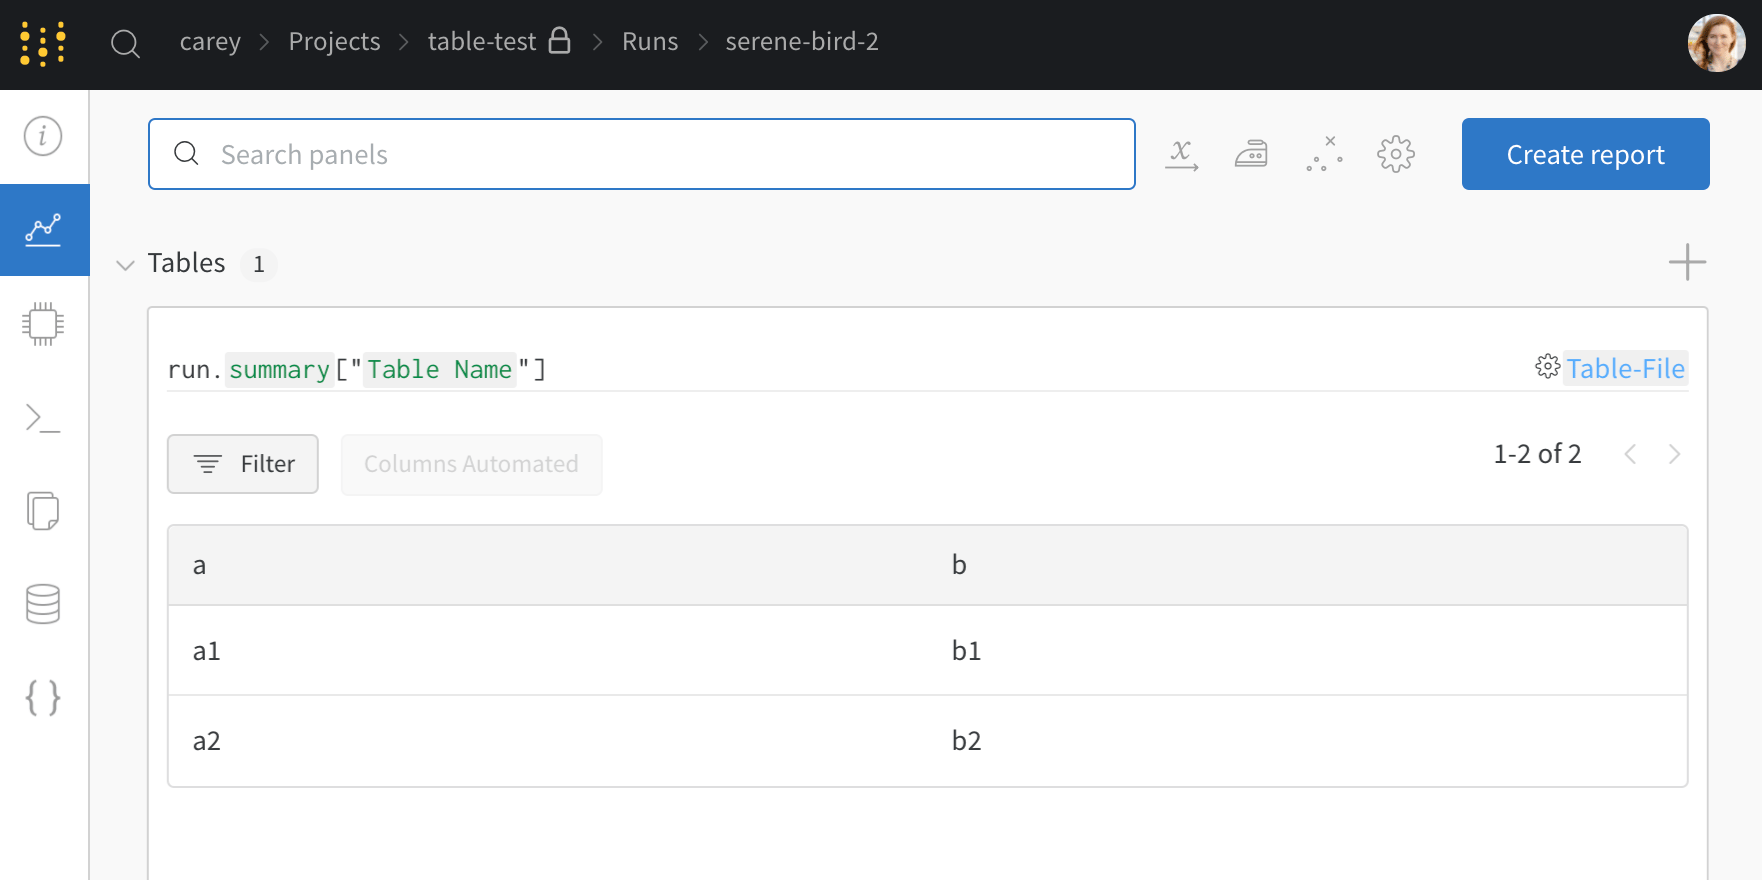
2. Select the name of your run in your project workspace. A new panel is added for each unique table key.
In this example, `my_table`, is logged under the key `"Table Name"`.
## 3. Compare across model versions
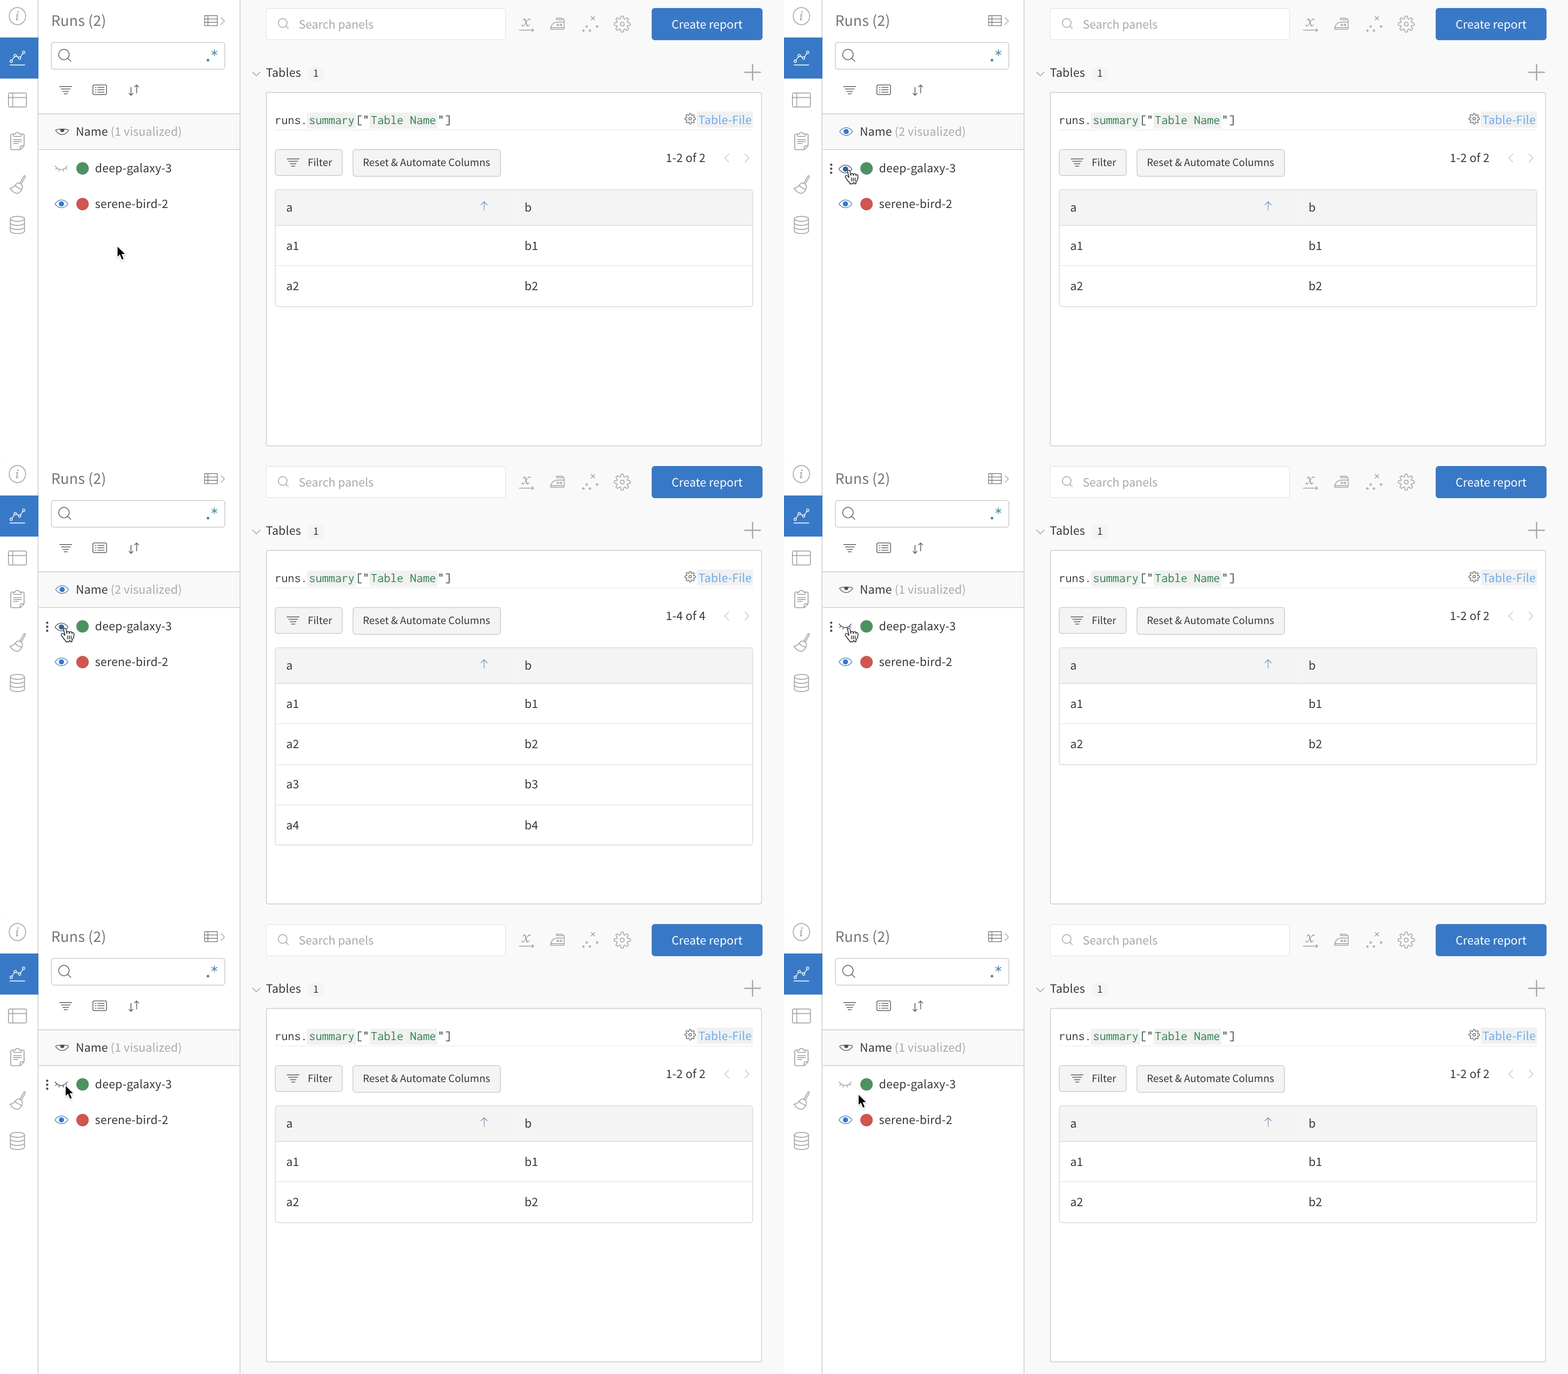
Log sample tables from multiple W\&B Runs and compare results in the project workspace. In this [example workspace](https://wandb.ai/carey/table-test?workspace=user-carey), we show how to combine rows from multiple different versions in the same table.
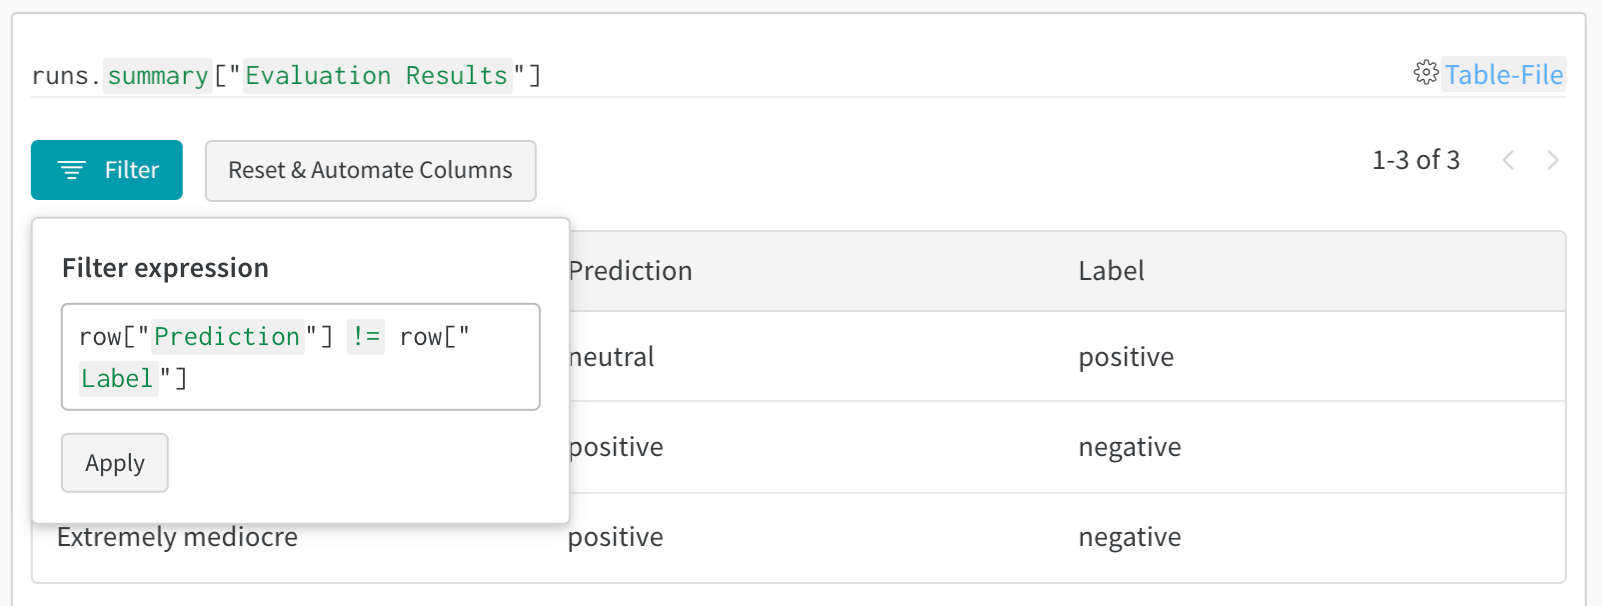
Use the table filter, sort, and grouping features to explore and evaluate model results.
 In this example, `my_table`, is logged under the key `"Table Name"`.
## 3. Compare across model versions
Log sample tables from multiple W\&B Runs and compare results in the project workspace. In this [example workspace](https://wandb.ai/carey/table-test?workspace=user-carey), we show how to combine rows from multiple different versions in the same table.
In this example, `my_table`, is logged under the key `"Table Name"`.
## 3. Compare across model versions
Log sample tables from multiple W\&B Runs and compare results in the project workspace. In this [example workspace](https://wandb.ai/carey/table-test?workspace=user-carey), we show how to combine rows from multiple different versions in the same table.
 Use the table filter, sort, and grouping features to explore and evaluate model results.