> ## Documentation Index
> Fetch the complete documentation index at: https://wb-21fd5541-docs-sandboxes-integrations-placement.mintlify.site/llms.txt
> Use this file to discover all available pages before exploring further.

> W&B で機械学習実験をトラッキングし、メトリクス、ハイパーパラメーター、システムメトリクス、モデルArtifactsをログします。

# Experiments の概要

export const TryProductLink = ({url}) => <a href={url} target="_blank" rel="noopener noreferrer" className="github-source-link">
    <svg width="20" height="20" viewBox="0 0 24 24" fill="none" stroke="currentColor" strokeWidth="2" strokeLinecap="round" strokeLinejoin="round" xmlns="http://www.w3.org/2000/svg">
      <line x1="4" y1="21" x2="4" y2="14"></line>
      <line x1="4" y1="10" x2="4" y2="3"></line>
      <line x1="12" y1="21" x2="12" y2="12"></line>
      <line x1="12" y1="8" x2="12" y2="3"></line>
      <line x1="20" y1="21" x2="20" y2="16"></line>
      <line x1="20" y1="12" x2="20" y2="3"></line>
      <circle cx="4" cy="12" r="2"></circle>
      <circle cx="12" cy="10" r="2"></circle>
      <circle cx="20" cy="14" r="2"></circle>
    </svg>
    W&amp;Bで試す
  </a>;

export const ColabLink = ({url}) => <a href={url} target="_blank" rel="noopener noreferrer" className="colab-link">
    <svg width="20" height="20" viewBox="0 0 24 24" fill="currentColor" xmlns="http://www.w3.org/2000/svg">
      <path d="M14.25.18l.9.2.73.26.59.3.45.32.34.34.25.34.16.33.1.3.04.26.02.2-.01.13V8.5l-.05.63-.13.55-.21.46-.26.38-.3.31-.33.25-.35.19-.35.14-.33.1-.3.07-.26.04-.21.02H8.77l-.69.05-.59.14-.5.22-.41.27-.33.32-.27.35-.2.36-.15.37-.1.35-.07.32-.04.27-.02.21v3.06H3.17l-.21-.03-.28-.07-.32-.12-.35-.18-.36-.26-.36-.36-.35-.46-.32-.59-.28-.73-.21-.88-.14-1.05-.05-1.23.06-1.22.16-1.04.24-.87.32-.71.36-.57.4-.44.42-.33.42-.24.4-.16.36-.1.32-.05.24-.01h.16l.06.01h8.16v-.83H6.18l-.01-2.75-.02-.37.05-.34.11-.31.17-.28.25-.26.31-.23.38-.2.44-.18.51-.15.58-.12.64-.1.71-.06.77-.04.84-.02 1.27.05zm-6.3 1.98l-.23.33-.08.41.08.41.23.34.33.22.41.09.41-.09.33-.22.23-.34.08-.41-.08-.41-.23-.33-.33-.22-.41-.09-.41.09zm13.09 3.95l.28.06.32.12.35.18.36.27.36.35.35.47.32.59.28.73.21.88.14 1.04.05 1.23-.06 1.23-.16 1.04-.24.86-.32.71-.36.57-.4.45-.42.33-.42.24-.4.16-.36.09-.32.05-.24.02-.16-.01h-8.22v.82h5.84l.01 2.76.02.36-.05.34-.11.31-.17.29-.25.25-.31.24-.38.2-.44.17-.51.15-.58.13-.64.09-.71.07-.77.04-.84.01-1.27-.04-1.07-.14-.9-.2-.73-.25-.59-.3-.45-.33-.34-.34-.25-.34-.16-.33-.1-.3-.04-.25-.02-.2.01-.13v-5.34l.05-.64.13-.54.21-.46.26-.38.3-.32.33-.24.35-.2.35-.14.33-.1.3-.06.26-.04.21-.02.13-.01h5.84l.69-.05.59-.14.5-.21.41-.28.33-.32.27-.35.2-.36.15-.36.1-.35.07-.32.04-.28.02-.21V6.07h2.09l.14.01.21.03zm-6.47 14.25l-.23.33-.08.41.08.41.23.33.33.23.41.08.41-.08.33-.23.23-.33.08-.41-.08-.41-.23-.33-.33-.23-.41-.08-.41.08z" />
    </svg>
    Colabで試す
  </a>;

<CardGroup cols={4}>
  <ColabLink url="https://colab.research.google.com/github/wandb/examples/blob/master/colabs/intro/Intro_to_Weights_%26_Biases.ipynb" />

  <TryProductLink url="https://wandb.ai/stacey/deep-drive/workspace?workspace=user-lavanyashukla" />
</CardGroup>

数行のコードで機械学習の実験をトラッキングできます。結果はその後、[インタラクティブなダッシュボード](/ja/models/track/workspaces/)で確認したり、[Public API](/ja/models/ref/python/public-api/)を使ってプログラムからアクセスできるように Python にエクスポートしたりできます。

[Keras](/ja/models/integrations/keras) などの主要なフレームワークを使用している場合は、W\&B Integrations を活用してください。インテグレーションの一覧と、コードに W\&B を追加する方法については、[W\&B Integrations](/ja/models/integrations) を参照してください。

<Frame>
  <img src="https://mintcdn.com/wb-21fd5541-docs-sandboxes-integrations-placement/o_NUj-zO1if2NqBx/images/experiments/experiments_landing_page.png?fit=max&auto=format&n=o_NUj-zO1if2NqBx&q=85&s=cebdd3754818fbaf2dc390df4ff49ec0" alt="Experiments ダッシュボード" width="4354" height="2978" data-path="images/experiments/experiments_landing_page.png" />
</Frame>

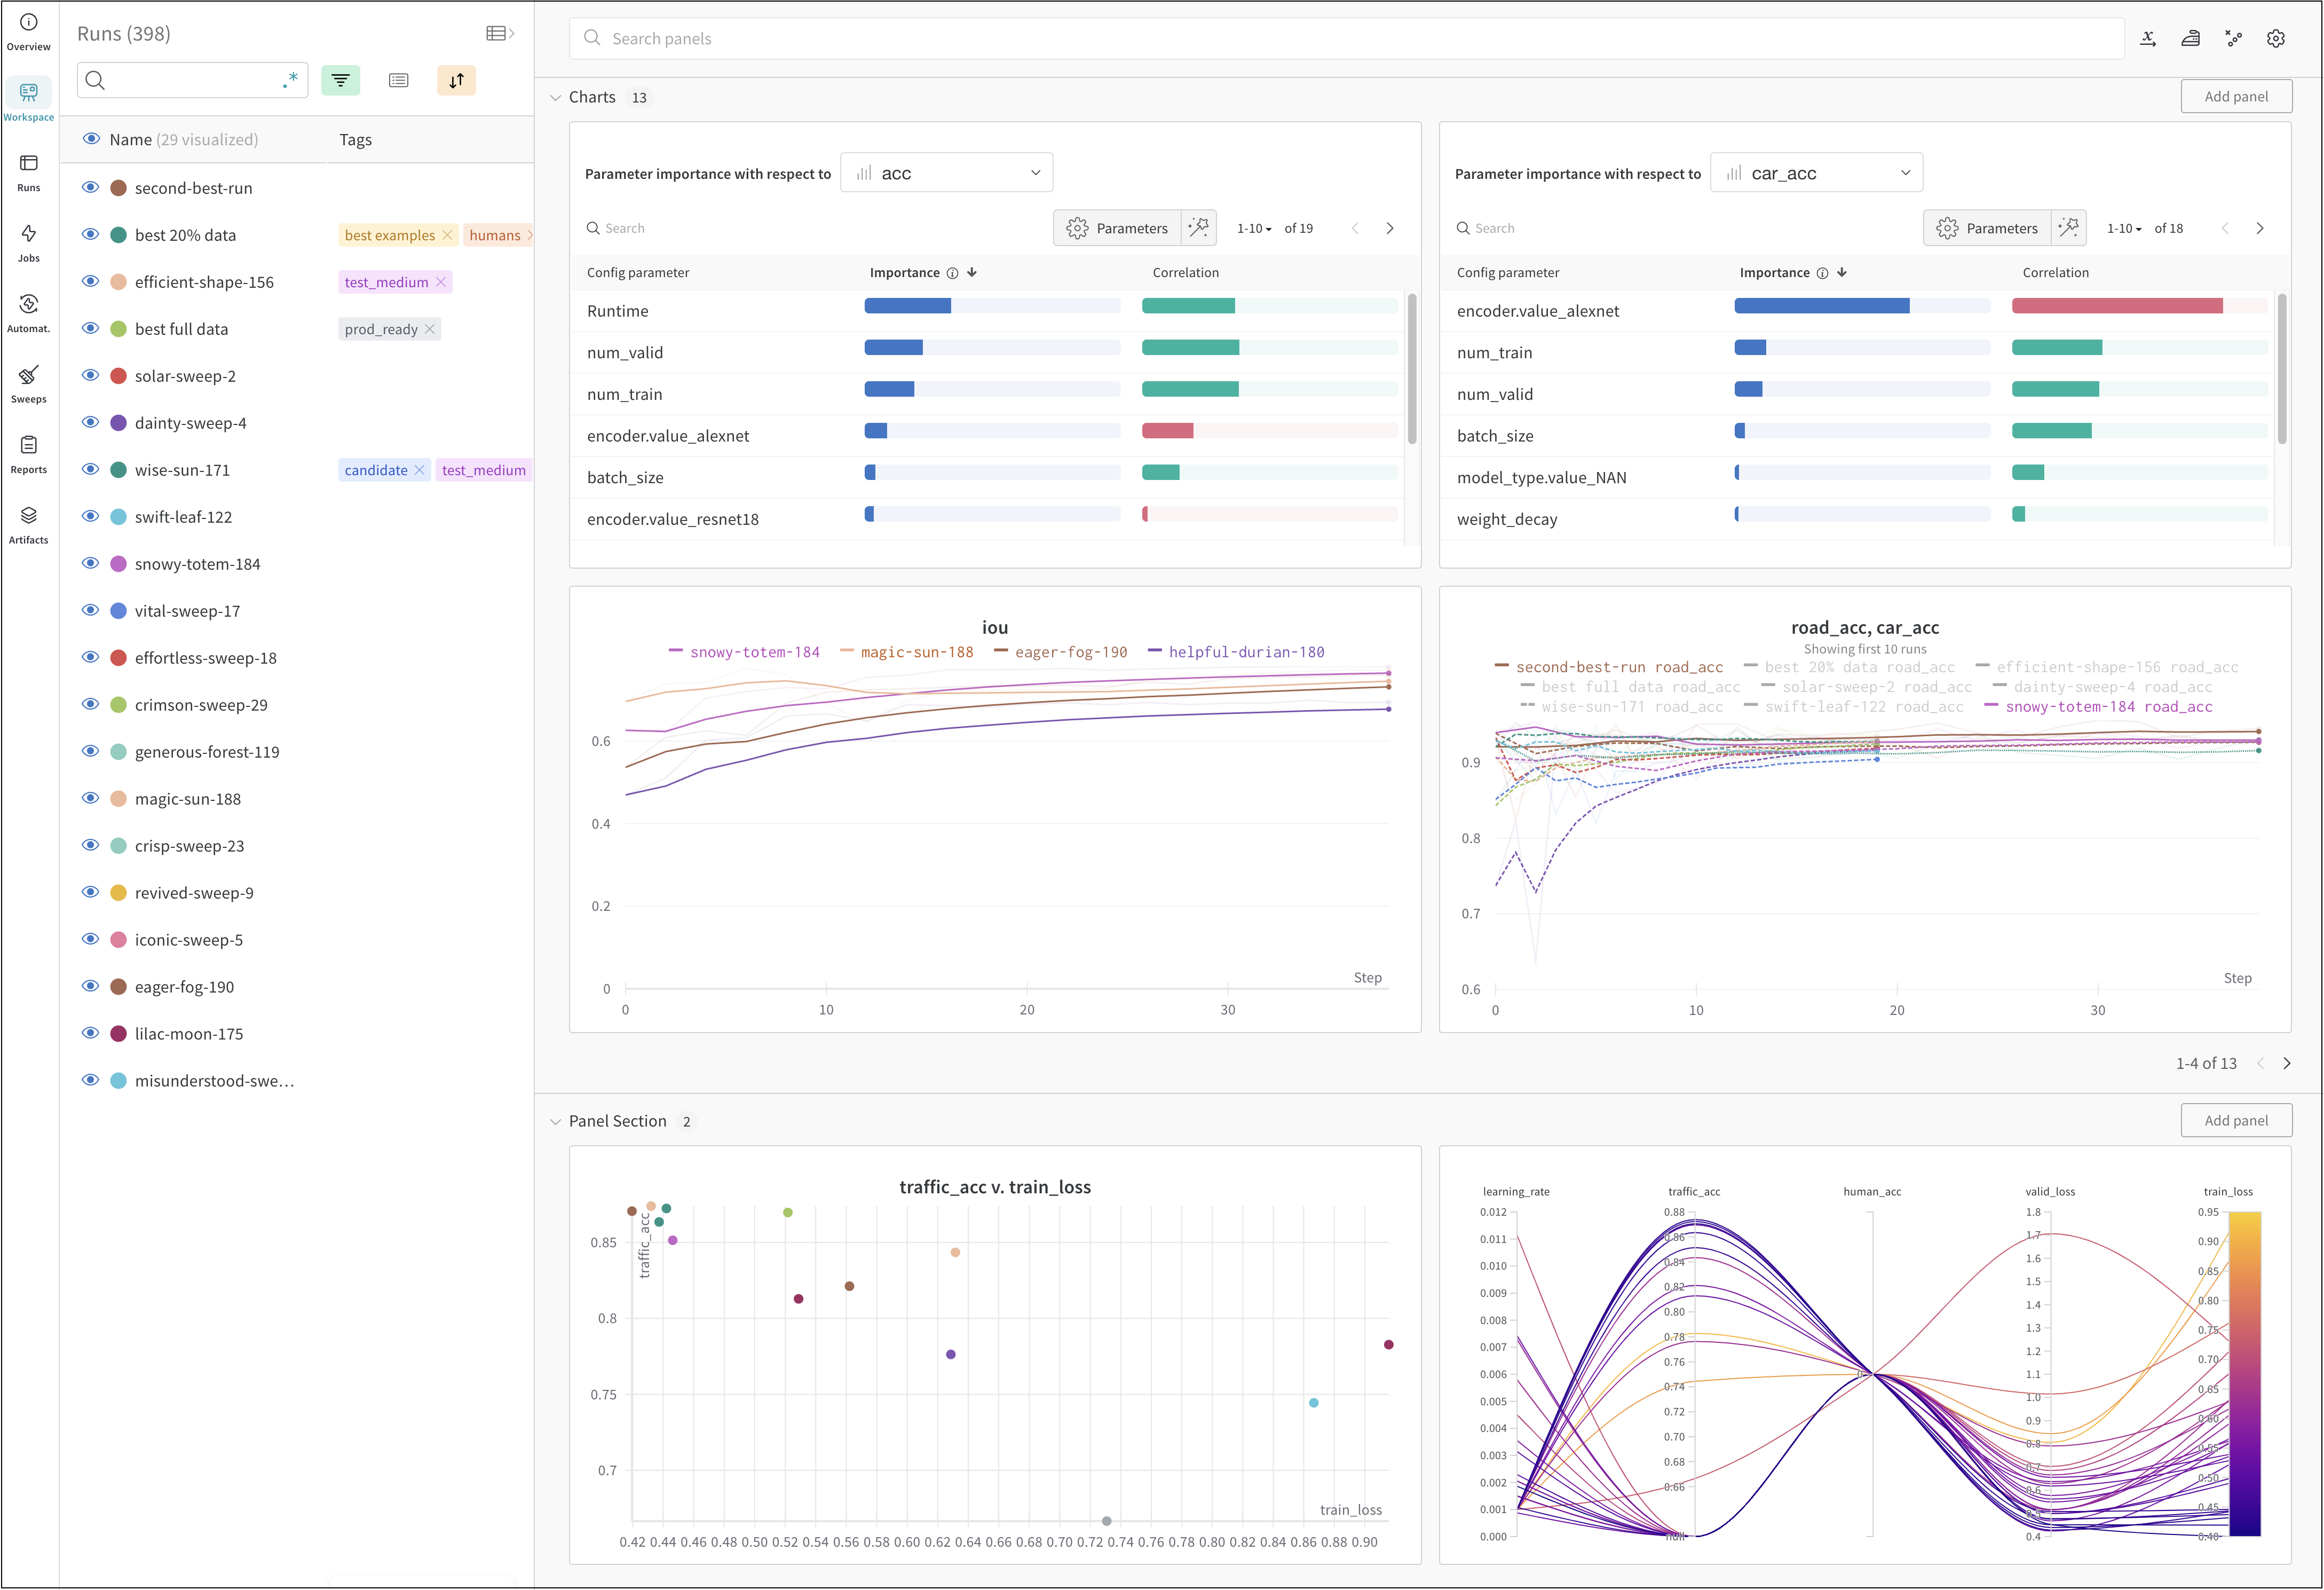
上の画像は、複数の[runs](/ja/models/runs/)にまたがるメトリクスを表示・比較できるダッシュボードの例です。

<div id="how-it-works">
  ## 仕組み
</div>

数行のコードで機械学習の実験をトラッキングできます。

1. [W\&B Run](/ja/models/runs/) を作成します。
2. 学習率やモデルのタイプなどのハイパーパラメーターを辞書として設定 ([`wandb.Run.config`](/ja/models/track/config/)) に保存します。
3. 精度や損失などのメトリクスを、トレーニングループの中で継続的にログします ([`wandb.Run.log()`](/ja/models/track/log/)) 。
4. モデルの重みや予測結果の表など、run の出力を保存します。

次のコードは、W\&B で一般的な実験管理のワークフローを示しています。

```python theme={null}
# runを開始する。
#
# このブロックを抜けると、ログされたデータのアップロード完了を待機する。
# 例外が発生した場合、runは失敗としてマークされる。
with wandb.init(entity="", project="my-project-name") as run:
  # モデルの入力とハイパーパラメーターを保存する。
  run.config.learning_rate = 0.01

  # 実験コードを実行する。
  for epoch in range(num_epochs):
    # トレーニングを実行する...

    # モデル性能を可視化するため、メトリクスを継続的にログする。
    run.log({"loss": loss})

  # モデルの出力をArtifactsとしてアップロードする。
  run.log_artifact(model)
```

<div id="get-started">
  ## はじめに
</div>

ユースケースに応じて、W\&B 実験 を使い始める際は、次のリソースをご覧ください。

* データセット artifact を作成し、トラッキングして、使用するために使える W\&B Python SDK のコマンドを step ごとに説明した [W\&B クイックスタート](/ja/models/quickstart/) をお読みください。
* この章では、次の方法を学べます。
  * 実験 を作成する
  * 実験 を設定する
  * 実験 からデータをログする
  * 実験 の結果を確認する
* [W\&B API Reference Guide](/ja/models/ref/python/) の [W\&B Python Library](/ja/models/ref/python/) もご覧ください。

<div id="best-practices-and-tips">
  ## ベストプラクティスとヒント
</div>

実験 とログに関するベストプラクティスとヒントについては、[Best Practices: Experiments and Logging](https://wandb.ai/wandb/pytorch-lightning-e2e/reports/W-B-Best-Practices-Guide--VmlldzozNTU1ODY1#w\&b-experiments-and-logging)を参照してください。
