> ## Documentation Index
> Fetch the complete documentation index at: https://wb-21fd5541-docs-sandboxes-integrations-placement.mintlify.site/llms.txt
> Use this file to discover all available pages before exploring further.
> このページの一部の機能はベータ版で、機能フラグの設定時にのみ利用できます。 関連するすべての機能を有効にするには、プロフィールページの自己紹介に `weave-plot` を追加してください。
# クエリパネルの概要
W\&B Weave、つまり生成 AI アプリケーション構築向けの W\&B のツールスイートをお探しですか? [Weave ドキュメント](https://wandb.github.io/weave/?utm_source=wandb_docs\&utm_medium=docs\&utm_campaign=weave-nudge) を参照してください。
クエリパネルを使用すると、データをクエリしてインタラクティブに可視化できます。クエリパネルを使うと、特定の runs、アーティファクト、表、その他の W\&B オブジェクトを 1 つのビューに取り込み、Workspace や report を離れることなく、表やプロットとして探索できます。このページは、ログされた W\&B データに対してアドホッククエリを作成し、その結果を Workspace または report 内に表示したいユーザー向けです。
クエリパネルは、次の 3 つの要素で構成されます。
* **[式](#expressions)**: 選択したデータ。
* **[設定](#configurations)**: パネルタイプや歯車メニューのオプションなど、パネルの省略可能な設定。
* **[結果パネル](#result-panels)**: 表やプロットなど、結果の表示方法。
試せるインタラクティブな例については、公開 [Query panel examples report](https://wandb.ai/luis_team_test/weave_example_queries/reports/Query-Panel-Examples---Vmlldzo1NzIxOTY2) を参照してください。クエリ構文を順を追って学ぶには、[Query panel tutorial report](https://wandb.ai/luis_team_test/weave_example_queries/reports/Weave-queries---Vmlldzo1NzIxOTY2) を参照してください。生成されたタイプと Ops の一覧は、[query expression language overview](/ja/models/ref/query-panel) にあります。
## クエリパネルを作成する
式を記述して結果を可視化するための画面として、Workspaceまたはreport内にクエリパネルを追加します。
1. プロジェクトのWorkspaceにアクセスします。
2. 右上隅の `Add panel` をクリックします。
3. ドロップダウンから `Query panel` を選択します。
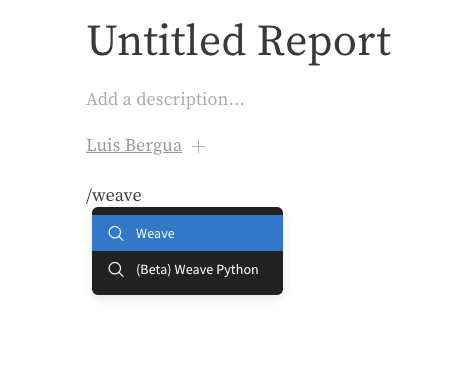
* `Type and select /Query panel` と入力して選択します。
 または、クエリを一連の run に関連付けることもできます。
1. report内で `Type and select /Panel grid` と入力して選択します。
2. `Add panel` ボタンをクリックします。
3. ドロップダウンから `Query panel` を選択します。
または、クエリを一連の run に関連付けることもできます。
1. report内で `Type and select /Panel grid` と入力して選択します。
2. `Add panel` ボタンをクリックします。
3. ドロップダウンから `Query panel` を選択します。
## Query components
以下のセクションでは、クエリパネル を構成する 3 つの要素、すなわちデータを選択する式、パネルの動作を制御する設定、そして output を表示する結果パネルについて説明します。
### 式
クエリ式を使用すると、W\&B に保存されている runs、アーティファクト、モデル、表 などのデータをクエリできます。
#### 例: 表をクエリする
W\&B の表をクエリしたいとします。トレーニングコード内で、`"cifar10_sample_table"` という名前の表をログします。
```python theme={null}
import wandb
with wandb.init() as run:
run.log({"cifar10_sample_table":[MY-TABLE]})
```
クエリパネル では、次を使って表をクエリできます。
```python theme={null}
runs.summary["cifar10_sample_table"]
```
 これを分解すると、次のようになります。
* `runs` は、クエリパネル が Workspace 内にある場合、クエリパネル expressions に自動的に追加される変数です。その値は、その Workspace で表示されている run のリストです。run で利用できるさまざまな属性の詳細については、[さまざまな属性を理解する](/ja/models/track/public-api-guide/#understanding-the-different-attributes) を参照してください。
* `summary` は、run の Summary オブジェクトを返す op です。Ops は *mapped* されるため、この op はリスト内の各 run に適用され、結果として Summary オブジェクトのリストが得られます。
* `["cifar10_sample_table"]` は Pick op (角括弧で表されます) で、キーは `cifar10_sample_table` です。Summary オブジェクトは辞書やマップのように振る舞うため、この操作では各 Summary オブジェクトからそのフィールドを取り出します。
これを分解すると、次のようになります。
* `runs` は、クエリパネル が Workspace 内にある場合、クエリパネル expressions に自動的に追加される変数です。その値は、その Workspace で表示されている run のリストです。run で利用できるさまざまな属性の詳細については、[さまざまな属性を理解する](/ja/models/track/public-api-guide/#understanding-the-different-attributes) を参照してください。
* `summary` は、run の Summary オブジェクトを返す op です。Ops は *mapped* されるため、この op はリスト内の各 run に適用され、結果として Summary オブジェクトのリストが得られます。
* `["cifar10_sample_table"]` は Pick op (角括弧で表されます) で、キーは `cifar10_sample_table` です。Summary オブジェクトは辞書やマップのように振る舞うため、この操作では各 Summary オブジェクトからそのフィールドを取り出します。
### 設定
パネルの左上にあるギアアイコンをクリックして、クエリ設定を展開します。この設定では、パネルの種類や結果パネルのパラメーターを設定できます。
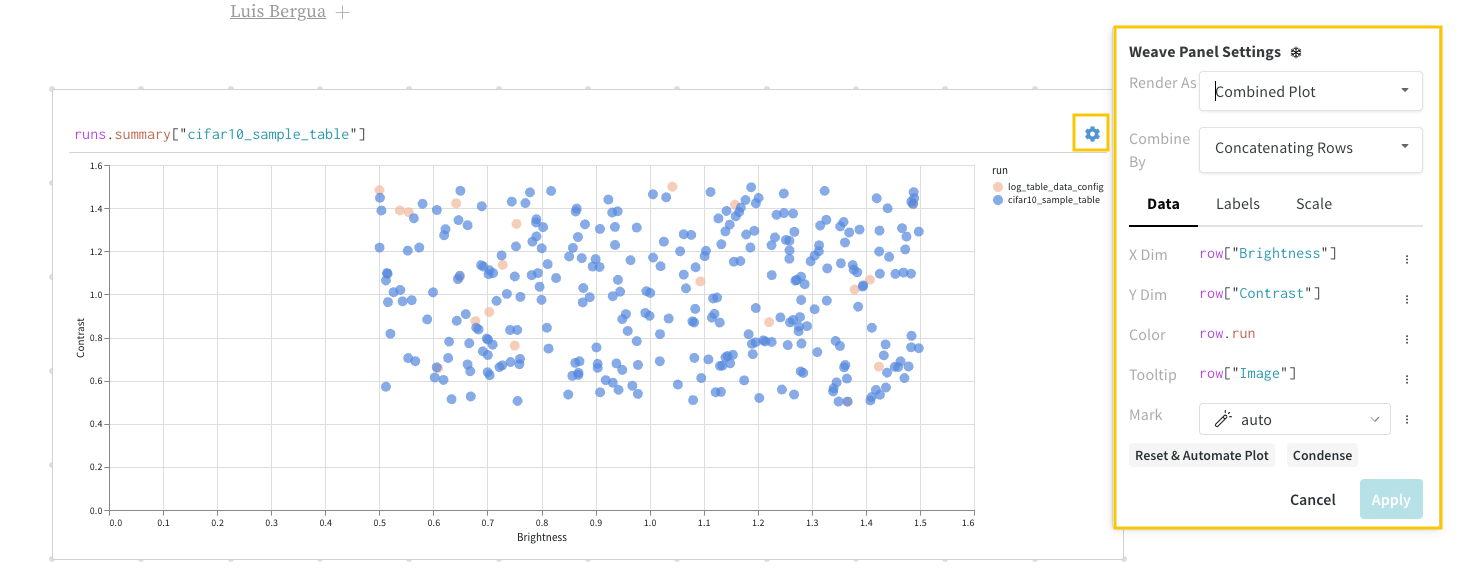
#### パネル オプション
設定メニューには、パネルが表形式の結果をどのように結合または読み込むかを変更するオプションが含まれる場合があります。表示されるラベルや利用可否は、式やパネル タイプによって異なります。具体的な設定例については、[Query panel examples report](https://wandb.ai/luis_team_test/weave_example_queries/reports/Query-Panel-Examples---Vmlldzo1NzIxOTY2)を参照してください。
**Concat**
互換性のある表形式の結果をパネルで結合し、それらを表示や後続の操作のために 1 つの表として扱うようにする場合は、設定で **Concat** を使用します。式レベルでの行の結合 (たとえば、クエリ内の `concat` や `join`) は、この設定とは別です。詳細は、[式で表を結合する](#combine-tables-in-expressions)を参照してください。
**Paginate**
表の結果が大きすぎて一度に表示できない可能性がある場合は、**Paginate** を使用します。ページネーションでは行をチャンク単位で読み込むため、パネルの応答性を維持できます。このオプションは、大きな行リストを返す式と組み合わせて使用してください。ページネーションでうまく機能するパターンについては、[Query panel examples report](https://wandb.ai/luis_team_test/weave_example_queries/reports/Query-Panel-Examples---Vmlldzo1NzIxOTY2)を参照してください。
### 結果パネル
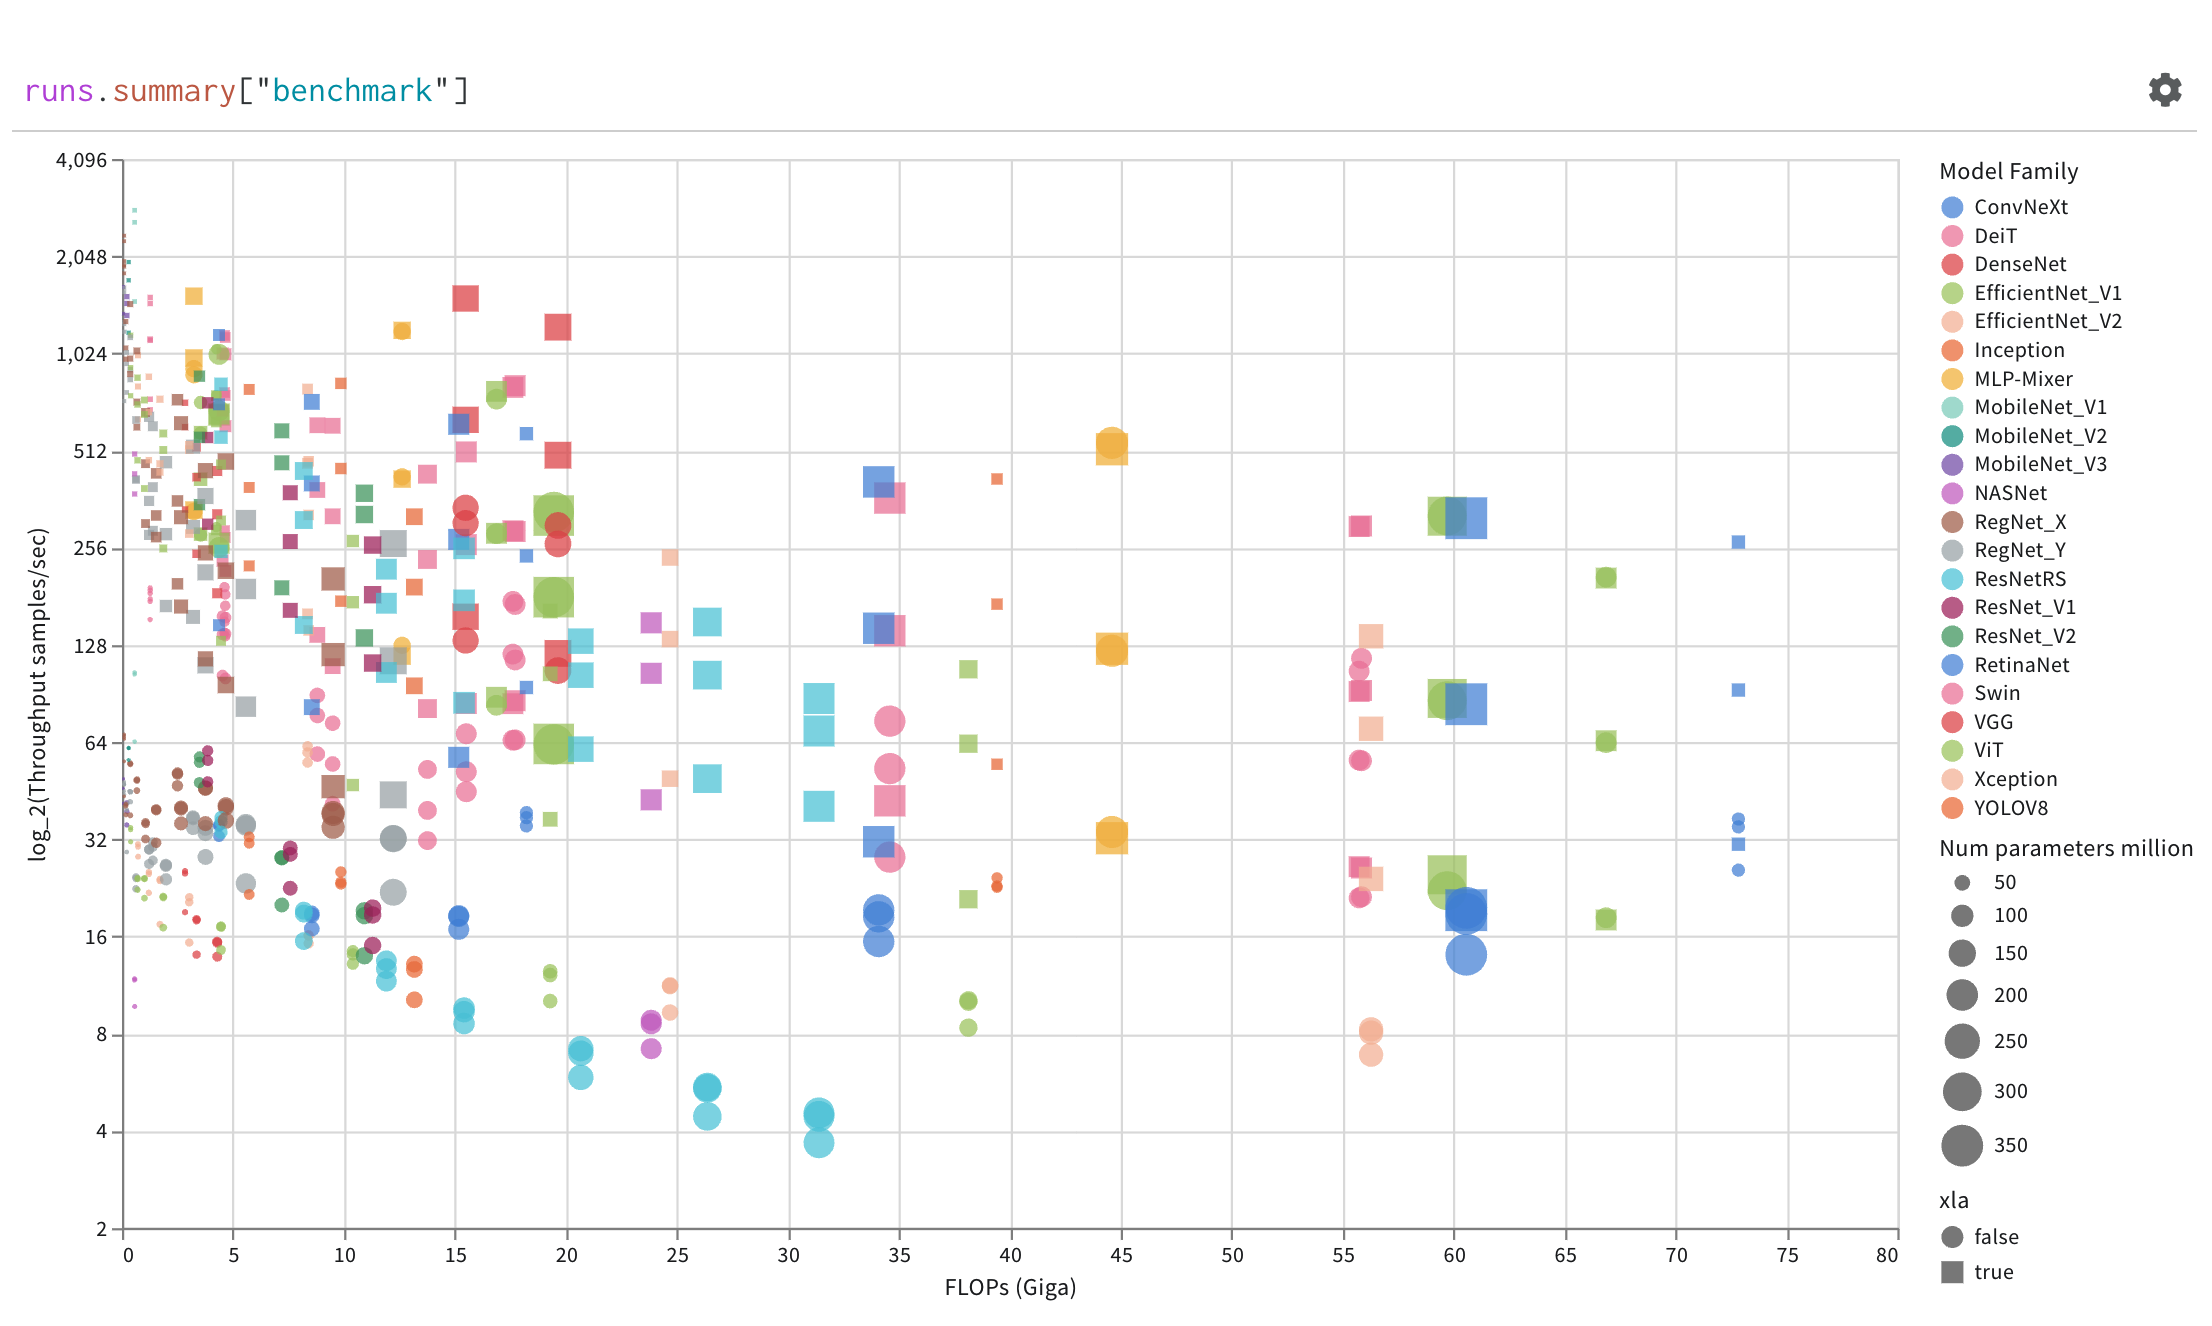
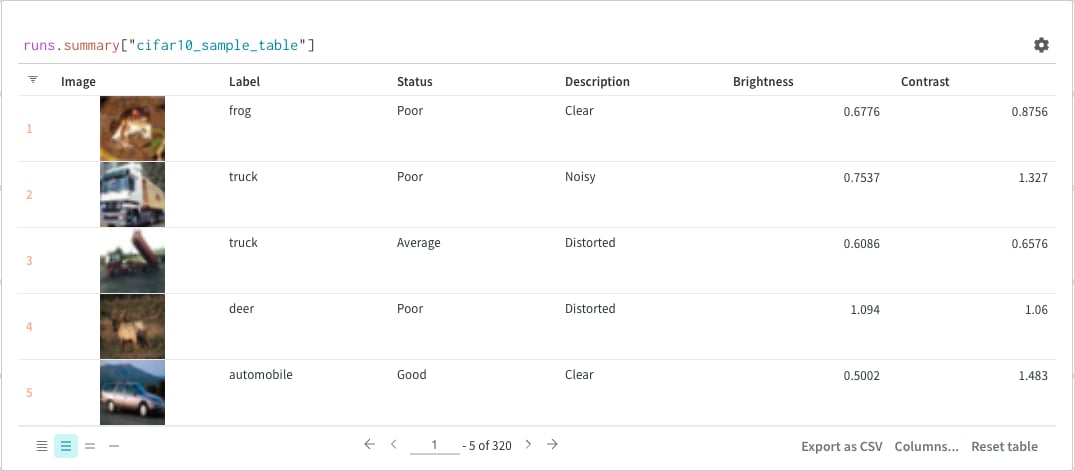
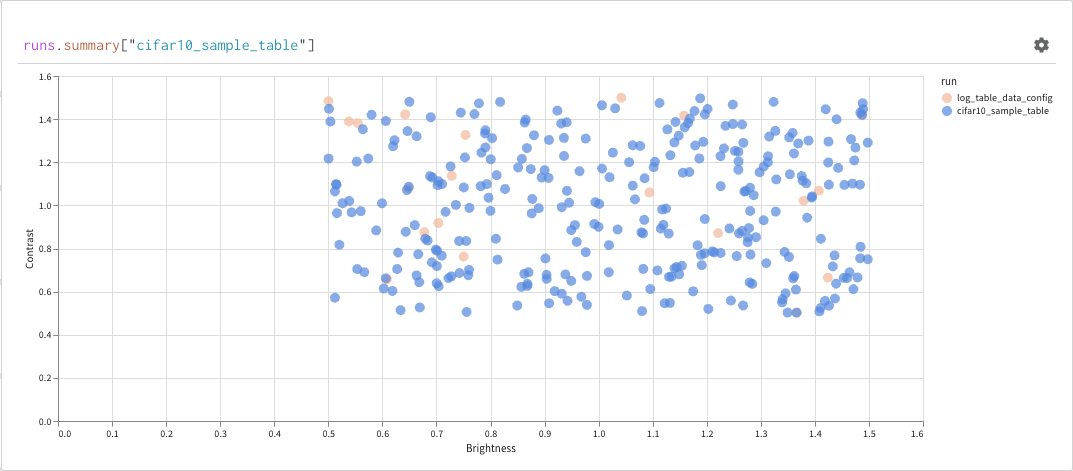
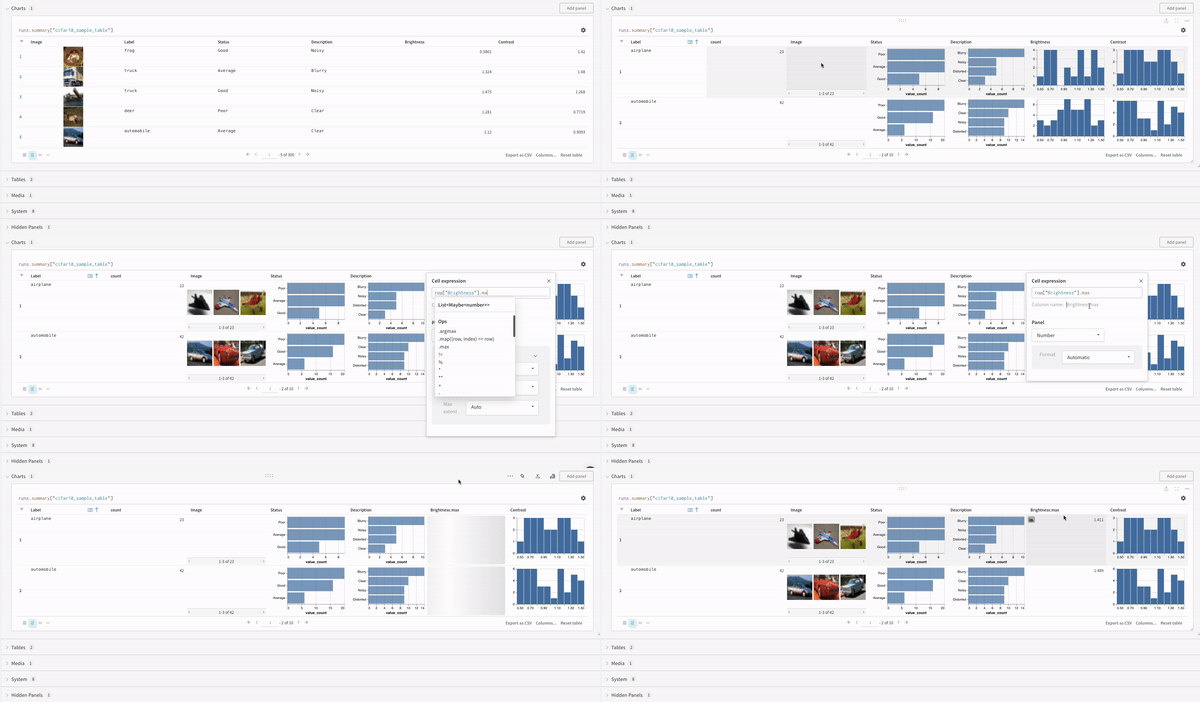
クエリ結果パネルにはクエリ式の結果が表示されます。表示には選択したクエリパネルが使用され、データがインタラクティブな形式で表示されるように設定されています。以下の画像は、同じデータを表とプロットで表示した例です。
### run 履歴をステップごとにたどる
`runs` または `runs.history` から作成した表やプロットでは、アプリに **step** コントロール (たとえばスライダー) を表示して、ログされた step を移動しながら、Runs の進行に沿ってメトリクス、テキスト、メディアを確認できます。式を変更した後、クエリパネル の設定を編集し、**Render As** を **Stepper** に変更してください。データのログ方法により適している場合は、このコントロールで `_step` ではなく別のメトリクスを追跡できます。式のサンプルについては、[クエリパネル examples report](https://wandb.ai/luis_team_test/weave_example_queries/reports/Query-Panel-Examples---Vmlldzo1NzIxOTY2) を参照してください。
## 基本操作
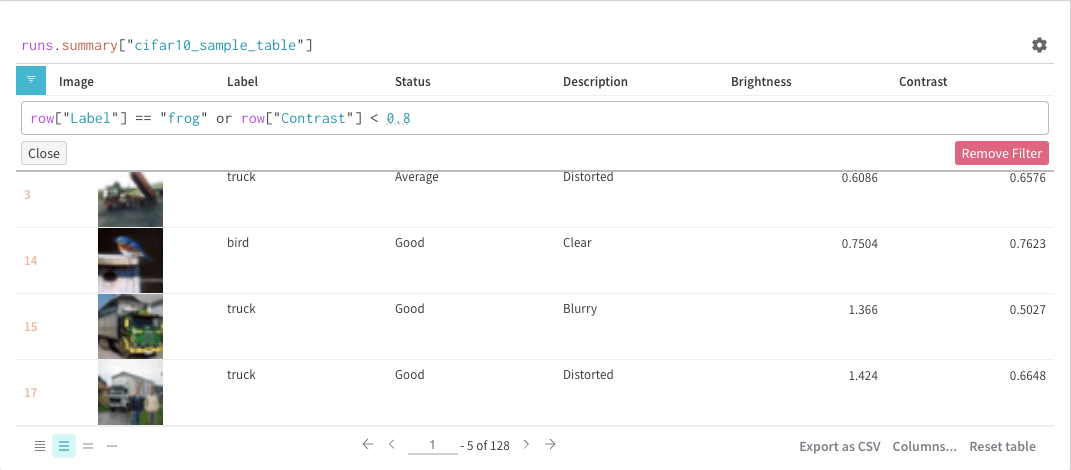
クエリパネルに結果が表示されたら、行の並べ替え、フィルター、マッピング、グループ化によって表示内容を調整できます。以下は、クエリパネル内で実行できる一般的な操作です。
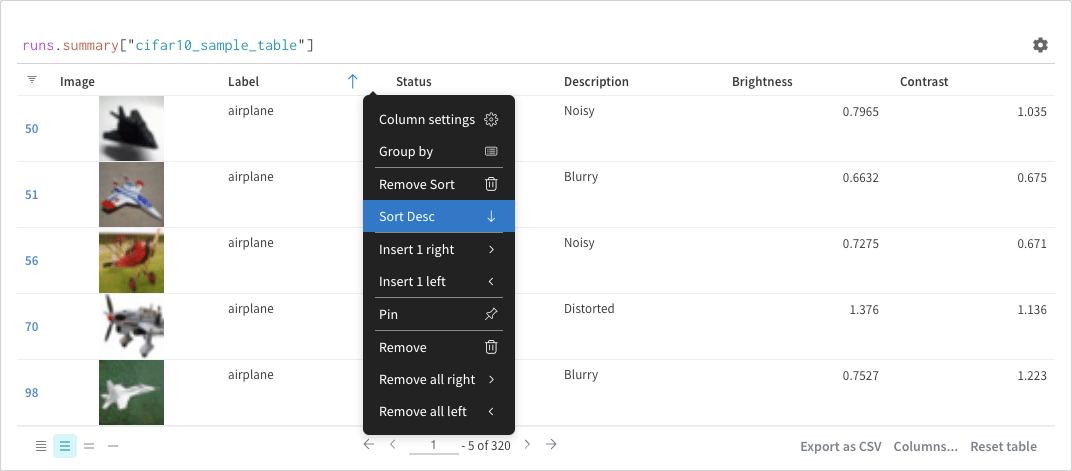
### 並べ替え
列オプションから並べ替えます:
### フィルター
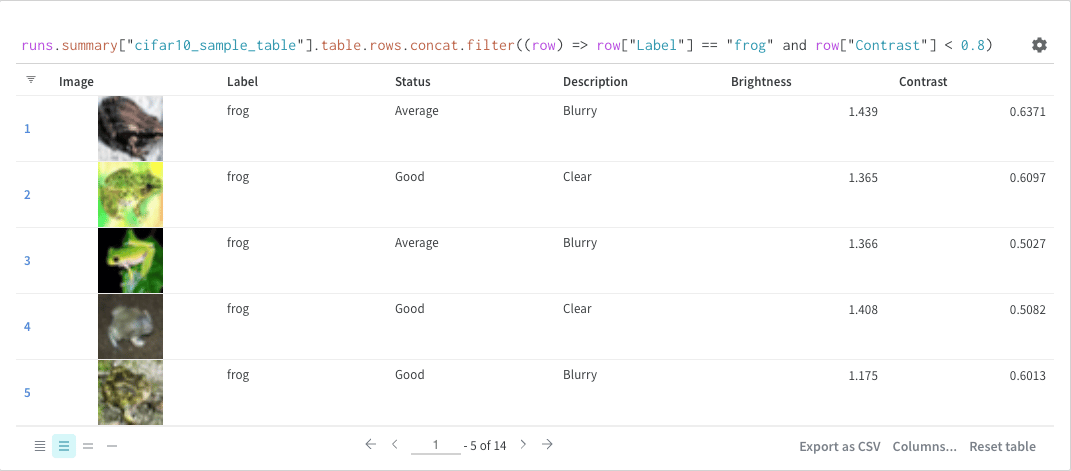
クエリ内で直接フィルターすることも、パネルの左上隅にあるフィルターボタンを使うこともできます
### マップ
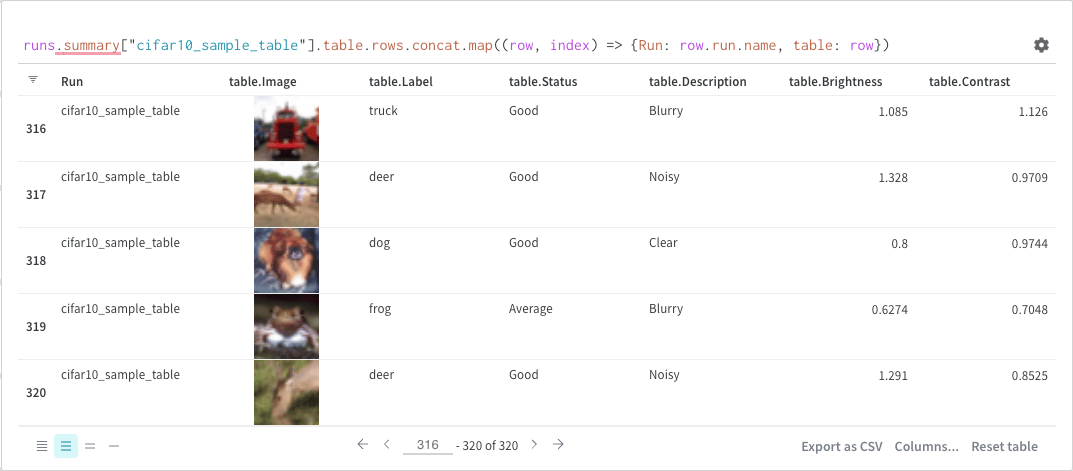
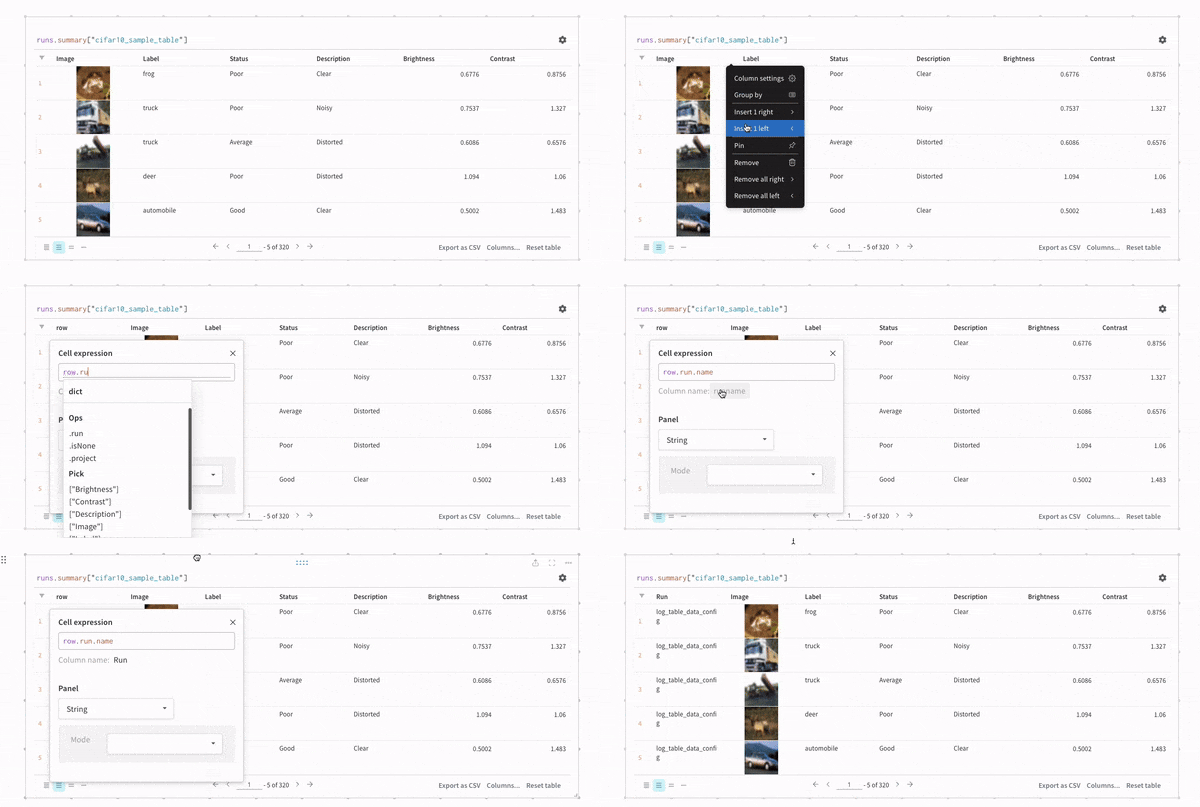
マップ操作では、リストを走査し、データ内の各要素に関数を適用します。これは、パネルのクエリを使って直接行うことも、列オプションから新しい列を挿入して行うこともできます。
### グループ化
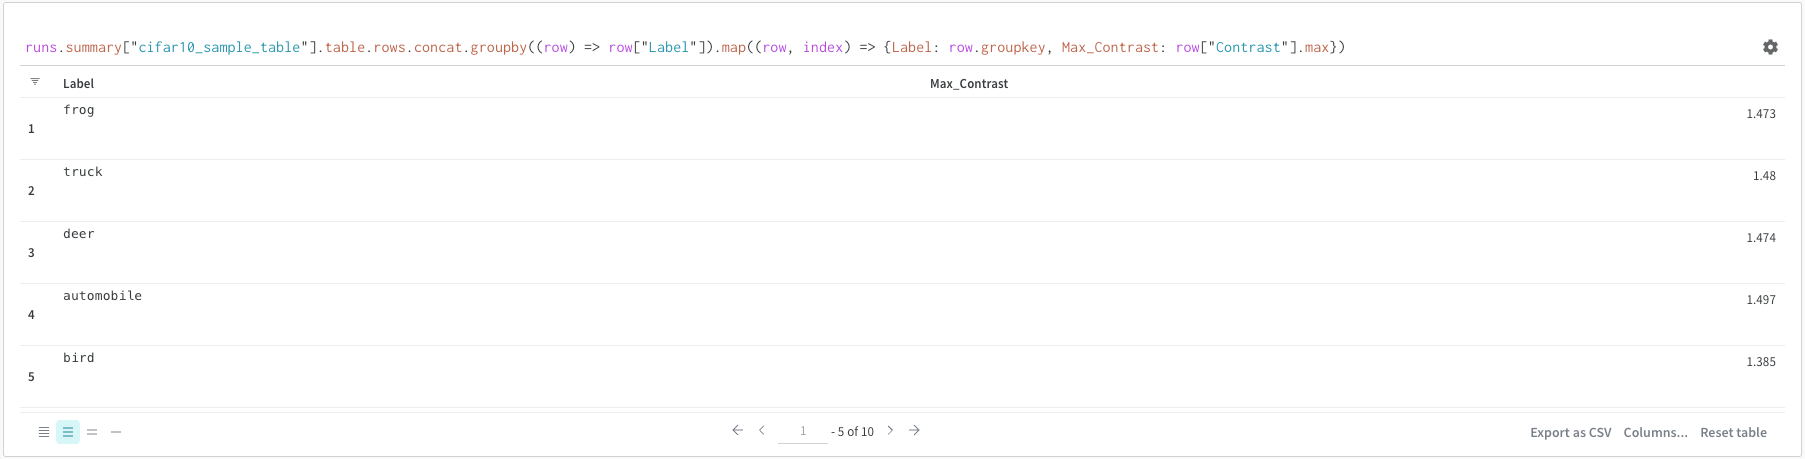
クエリまたは列オプションからグループ化できます。
### 式で表を結合する
表の行リストを連結またはマージする必要がある場合は、式内で `concat`、`join`、および関連する演算を使用します。完全な例については、[Join](#join)を参照してください。[Panel options](#panel-options) の **Concat** と **Paginate** は、UI で表の結果をどのように結合し、読み込むかを制御する別個のコントロールです。
### 結合
クエリ内で表を直接結合することもできます。次のクエリ式を確認しましょう。
```python theme={null}
project("luis_team_test", "weave_example_queries").runs.summary["short_table_0"].table.rows.concat.join(\
project("luis_team_test", "weave_example_queries").runs.summary["short_table_1"].table.rows.concat,\
(row) => row["Label"],(row) => row["Label"], "Table1", "Table2",\
"false", "false")
```
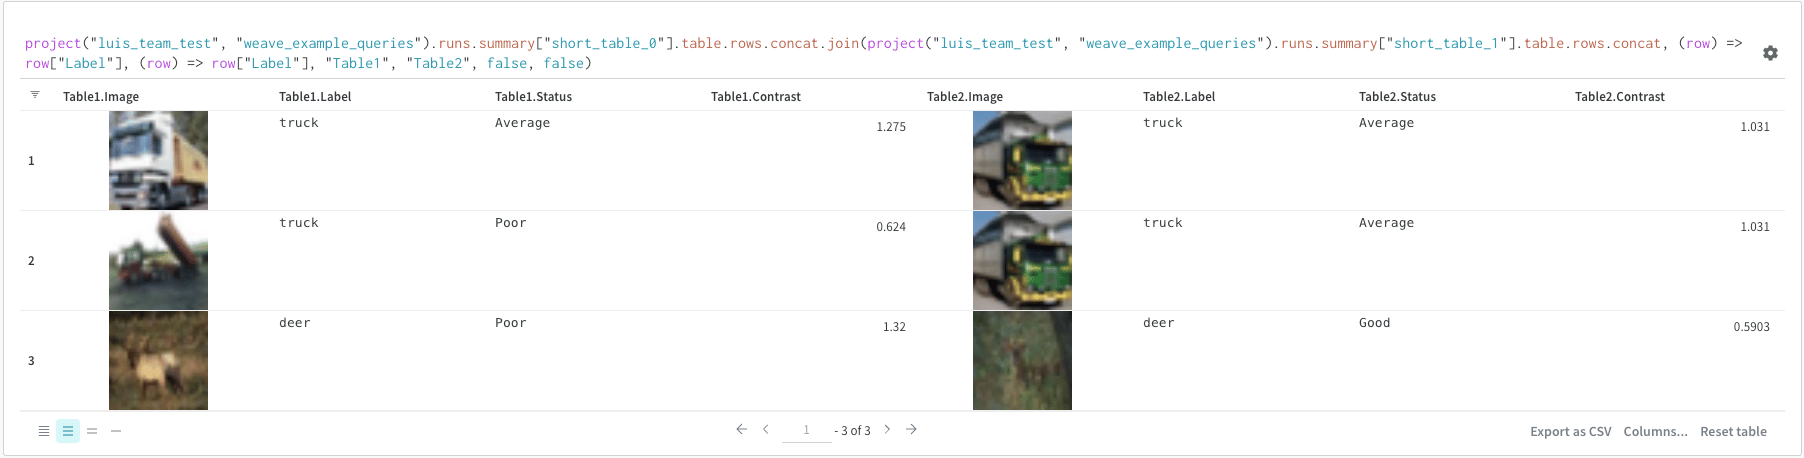 左側の表は以下から生成されます:
```python theme={null}
project("luis_team_test", "weave_example_queries").\
runs.summary["short_table_0"].table.rows.concat.join
```
右側の表は以下から生成されます:
```python theme={null}
project("luis_team_test", "weave_example_queries").\
runs.summary["short_table_1"].table.rows.concat
```
ここで、
* `(row) => row["Label"]` は各表のセレクターで、結合に使用する列を指定します。
* `"Table1"` と `"Table2"` は、結合後の各表の名前です。
* `true` と `false` は、左側と右側の内部結合/外部結合の設定を指定します。
左側の表は以下から生成されます:
```python theme={null}
project("luis_team_test", "weave_example_queries").\
runs.summary["short_table_0"].table.rows.concat.join
```
右側の表は以下から生成されます:
```python theme={null}
project("luis_team_test", "weave_example_queries").\
runs.summary["short_table_1"].table.rows.concat
```
ここで、
* `(row) => row["Label"]` は各表のセレクターで、結合に使用する列を指定します。
* `"Table1"` と `"Table2"` は、結合後の各表の名前です。
* `true` と `false` は、左側と右側の内部結合/外部結合の設定を指定します。
## Runs オブジェクト
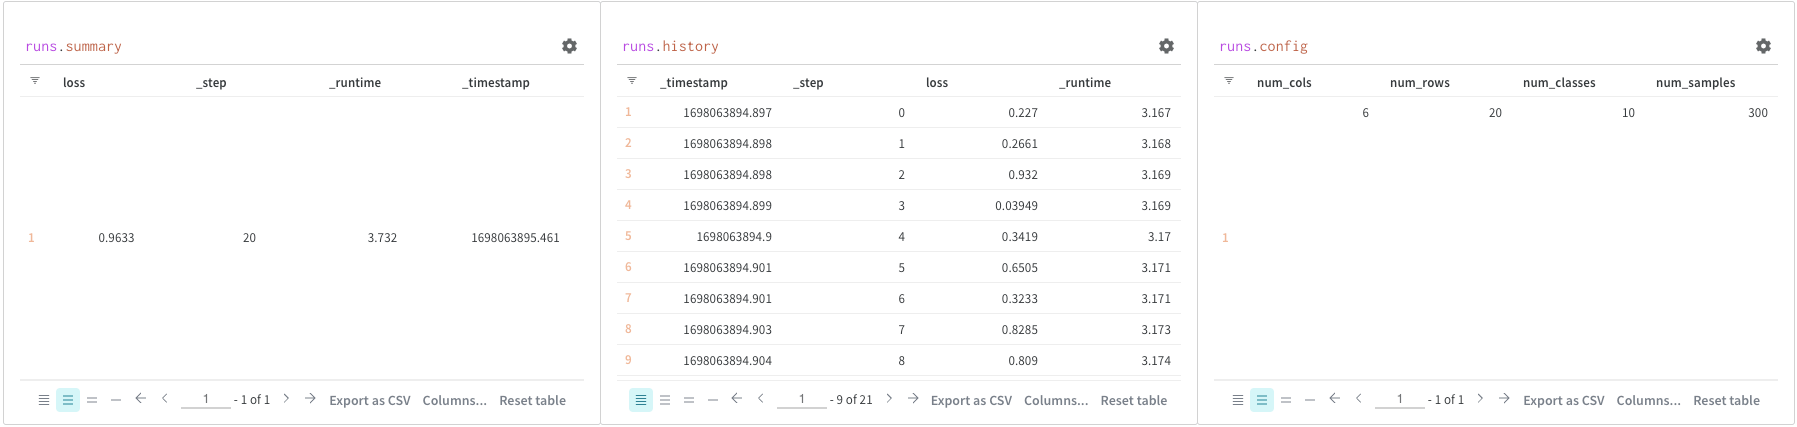
クエリパネルを使用して `runs` オブジェクトにアクセスします。run オブジェクトには、実験の記録が保存されます。詳細については、[runs オブジェクトへのアクセス](https://wandb.ai/luis_team_test/weave_example_queries/reports/Weave-queries---Vmlldzo1NzIxOTY2#3.-accessing-runs-object) を参照してください。ここでは、`runs` オブジェクトで利用できる主な項目を簡単に説明します。
* `summary`: run の結果を要約した情報を格納する辞書です。summary には、accuracy や損失のようなスカラー値だけでなく、大きなファイルが含まれることもあります。デフォルトでは、`wandb.Run.log()` によって、ログされた時系列の最終値が summary に設定されます。summary の内容は直接設定することもできます。summary は run の「出力」と考えてください。
* `history`: 損失のように、モデルのトレーニング中に変化する値を保存するための辞書のリストです。`wandb.Run.log()` コマンドはこのオブジェクトに追記します。
* `config`: トレーニング run のハイパーパラメーターや、データセット artifact を作成する run の前処理 method など、run の設定情報を含む辞書です。これらは run の「入力」と考えてください。
## アーティファクトにアクセスする
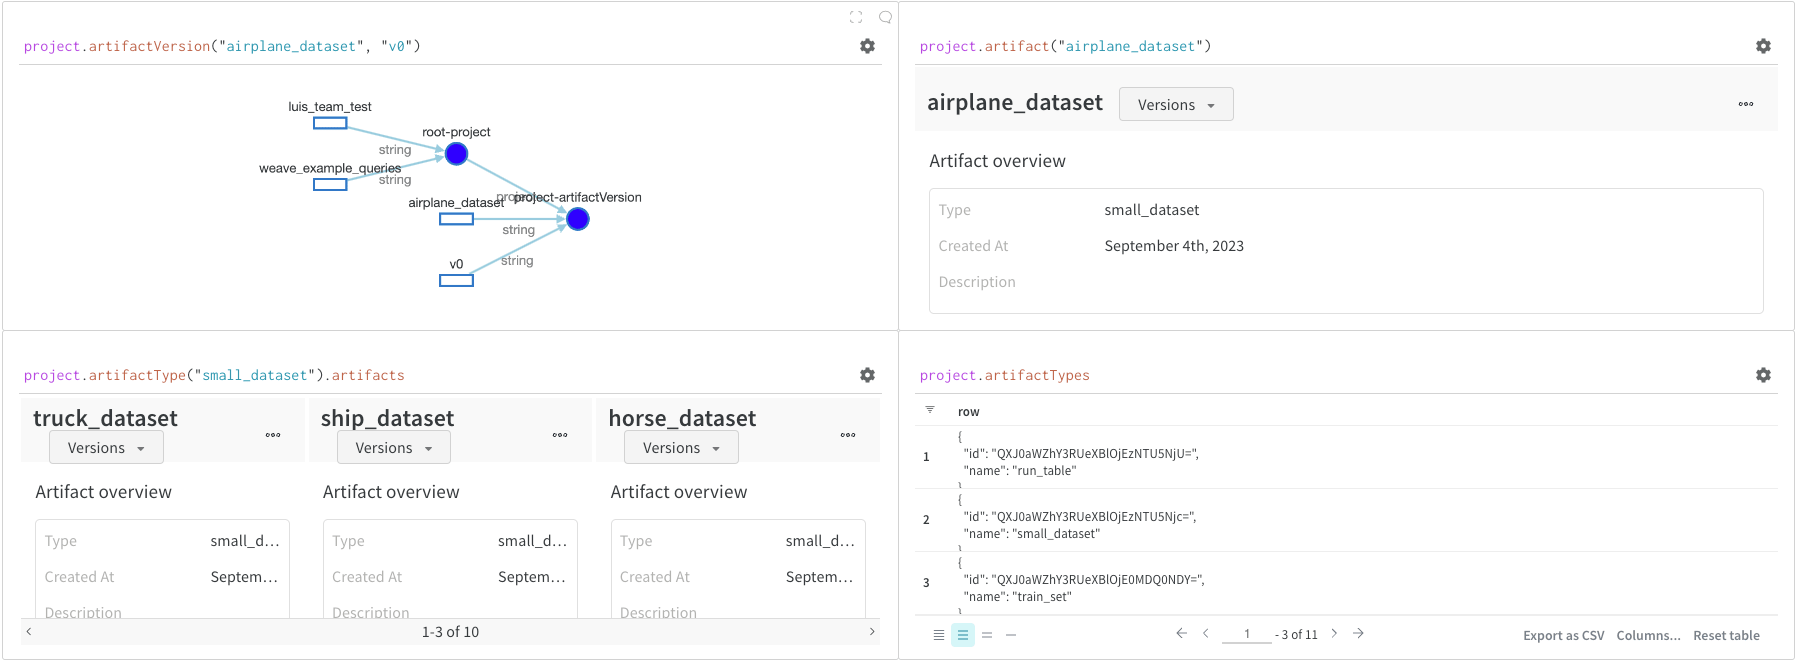
アーティファクトは、W\&B の中核となる概念です。アーティファクトは、バージョン管理された、名前付きのファイルおよびディレクトリのコレクションです。アーティファクトを使用すると、モデルの重み、データセット、そのほか任意の file やディレクトリをトラッキングできます。W\&B はアーティファクトを保存し、ダウンロードしたり、ほかの Runs で使用したりできます。詳細と examples については、[アーティファクトへのアクセス](https://wandb.ai/luis_team_test/weave_example_queries/reports/Weave-queries---Vmlldzo1NzIxOTY2#4.-accessing-artifacts)を参照してください。通常、アーティファクトには `project` オブジェクトからアクセスします。
* `project.artifactVersion()`: project 内の指定した名とバージョンに対応する特定の artifact version を返します。
* `project.artifact("")`: project 内の指定した名に対応する artifact を返します。その後、`.versions` を使用して、この artifact のすべてのバージョンのリストを取得できます。
* `project.artifactType()`: project 内の指定した名に対応する `artifactType` を返します。その後、`.artifacts` を使用して、このタイプのすべての artifact のリストを取得できます。
* `project.artifactTypes`: project 配下のすべての artifact types のリストを返します。